



Aftersales KPI reporting across several countries usually means one person, one spreadsheet and the first week of every month. A car importer and dealer group working across several European markets gets its service figures from each country in whatever form that country has: a system export, a PDF report, a table pasted into an email. The same metric has a different name in every file, and sometimes a different definition. We built a workflow that brings these reports into one regional board, flags what moved, sorts each change into “the data is wrong” or “something really happened”, and drafts the Monday summary for a person to approve.
The problem: five reports, five names for the same number
Putting one regional view together sounds like copy and paste. It is not, for four reasons:
- Every country sends a different format. Three send exports from different systems, as spreadsheets or CSV, one sends a PDF, one pastes a table into the body of an email, and one reports in a different currency.
- The same KPI has a different label everywhere. “Service orders closed”, “work orders” and “closed orders” are one metric, written in several languages.
- Some labels hide a different definition. One country reports technician productivity (hours sold divided by hours worked), the region uses efficiency (hours sold divided by hours available). Both numbers are correct, but they cannot be compared side by side.
- Most jumps are not real. A new column in a file, a survey that went out to only part of the customers or a definition change can move a number more than anything that happened in the workshops. Sending those to management as news costs trust.
What we built
A monthly workflow that starts from the files countries already send and ends with a summary a regional manager signs off:
- Take files as they arrive. Spreadsheet exports, CSV files, a PDF report and a table in an email body are all accepted. Nobody in the countries has to change how they report.
- Map local labels to one definitions dictionary. Eight regional KPIs, from service orders and hours sold to warranty rejection rate, NPS and repeat visits within 30 days, each with one written definition. The model reads each file and matches its columns to the dictionary. When a new column appears, it is flagged for a person instead of being guessed.
- Calculate the regional figures by rules. Code does the arithmetic: currency conversion at the monthly rate, sums for volumes, averages weighted by order count for ratios, and efficiency recalculated from hours sold and hours available. The model does not produce the numbers on the board.
- Flag deviations and say what kind they are. Every change against the previous month and the six-month trend that stands out is flagged and put into one of four types: data issue, definition difference, sample too small, or a likely real change in operations. Each flag shows the raw line from the source file next to a plain explanation and a suggested next step.
- A person decides on each flag. The regional manager marks a flag as “real change, escalate” or “data or definition error”. The decision moves it into the right part of the summary, and in a production setup it becomes a rule for next month.
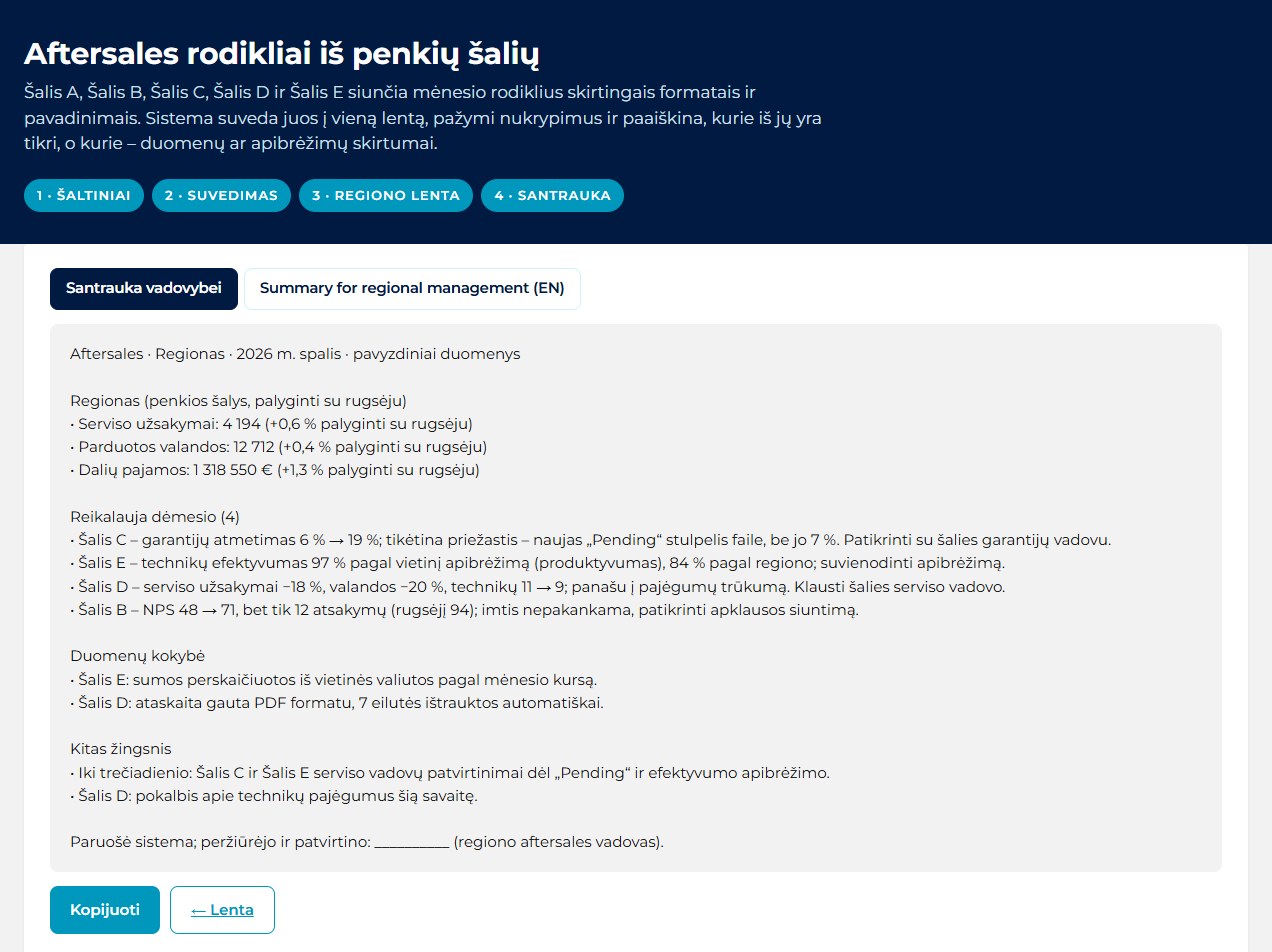
- Draft the Monday summary in two languages. Regional totals with changes against last month, the items that need attention, a data quality section and next steps, in the local language and in English. It ends with an empty “reviewed and approved by” line.
The build runs on synthetic data: five countries, eight KPIs and two months of figures written by hand, plus four earlier months generated around them so each KPI has a six-month trend line. The five source files cover five formats, from a 1,290-row spreadsheet export to a 9-row PDF report and a 10-row table in an email. Four deviations were planted, one of each type: a warranty rejection rate that jumped from 6% to 19% because a new “Pending” column was counted as rejected (7% without it); an efficiency of 97% that is 84% under the regional definition; an NPS that rose from 48 to 71 on 12 responses instead of 94; and a real drop in service orders of 18%, with technicians down from 11 to 9. Only the last one reaches the summary as a real change.


Does your regional report still get put together by hand from country spreadsheets? Book a 30-min call and we will look at your process together.
What changes for the regional aftersales team
| Before | With automated aftersales KPI reporting | |
|---|---|---|
| Country reports | Retyped or copied into one spreadsheet | Accepted as they are: exports, PDF, email tables |
| KPI names and definitions | Known by whoever builds the spreadsheet | One written dictionary, new columns flagged |
| Regional totals | Formulas maintained by hand | Calculated by code with stated weighting |
| A number that jumps | Reported as news, or chased by email | Sorted into data, definition, sample or real change |
| Evidence for each flag | Somewhere in the country file | Raw source line shown next to the explanation |
| Management summary | Written from scratch each month | Drafted in two languages, approved by a person |
Where people stay in control
The model reads files and writes explanations. It does not decide what management sees. Code calculates every number on the board, and every flag waits for a person to call it a real change or an error before the summary treats it that way. The summary is a draft with an empty approval line, not a report that sends itself.
The limits are clear. The figures in this build are synthetic, so reading accuracy has to be measured on real exports from each country before anyone relies on it. A PDF with a broken layout or a table typed freely into an email can be misread, which is why every flag shows the raw source line. The explanation of a deviation is a likely cause, not a finding: the country service manager confirms it. And a definitions dictionary is only as good as the agreement behind it, so the regional team owns it, not the system.
Where else this works
The same files-in, rules-for-numbers, person-approves approach fits any group that consolidates monthly figures from units that report differently:
- Retail and franchise networks: store and franchisee reports in different formats and currencies.
- Logistics and fleet operators: depot and country KPIs from different transport and workshop systems.
- Manufacturing groups: plant-level output, scrap and downtime reports rolled up for regional management.
Related use cases: Supplier invoice reconciliation · Shopping centre data analytics · Grain delivery reconciliation. All Document checks & reconciliation use cases · How we deliver this: AI automation
FAQ
Do the countries need to change their systems or report templates?
No. The workflow takes what each country already sends: a system export, a PDF or a table in an email. Local labels are mapped to one regional definitions dictionary, and a new or unknown column is flagged for a person.
Does AI calculate the KPIs?
No. The model reads the files and explains deviations. Currency conversion, regional totals, weighted averages and month-on-month changes are calculated by code, so the same input always gives the same board.
How does it tell a real change from a data problem?
Each deviation is sorted into one of four types: data issue, definition difference, sample too small, or likely real change. The raw source line is shown next to the explanation, and a person confirms or rejects it before it reaches the management summary.
Is your monthly regional report still built by hand from country files? Book a 30-min call or send us a message.
More on this: AI for real estate, logistics and trade · How we work · All use cases